This view allows retrieving simple user information about the processes in the STAGE system, e.g. when a user logs in or when an operating limit has been exceeded (e.g. when more than 80% of the channels of the WebRTC gateway are used).
Overview
Failed to load the diagram preview image.
Authentication Required
Page ID: 800293326
System Health - Events
Filters allow you to quickly narrow-down a list to find a device.
See chapter Getting familiar with the User Interface #Filtering for more information.
Quicksteps for Displaying and Exporting Event Log Entries
-
If you deactivate the Auto-Refresh of entries, you can…
-
select either a Time Range or a Custom Date Search to narrow down the list of desired entries.
-
Optionally, you can filter for the desired information on the Severity, User and/or Origin tabs to narrow down the list of desired entries.
-
Optionally, you can filter the desired information according to the Locations where the event was triggered.
-
Optionally, you can filter by Description.
-
View all displayed entries according to the corresponding filter settings. See #Event-Log-Entries for the available information.
-
To export the log entries…
-
Click on the Export Filtered Events button to save the log entries in a CSV file in the default download folder of your system. Only the currently visible entries are saved according to the current filter setting.
or -
Click on the Export System Logs button to save the log entries in a ZIP file containing the individual log files. The filename is the time stamp of the occurrence of the event. In a dialog you can select the day on which the entries occured. The exising entries are saved regardless of the current filter setting.
-

System Time, Auto-Refresh & Export
|
System Time |
Displays the current date and time of the STAGE cluster (and is always UTC). |
|---|---|
|
Auto-Refresh |
Set if the display of event logs are to be automatically refreshed. Enabled: Event logs are automatically updated to display the latest log data when new entries are recorded. Disabled: Events logs are loaded when you enter this page or refresh the page in your browser, otherwise the logging data is static. The Time Range and Custom Date Search filters are deactivated if Auto-Refresh is switched on. |
|
Export Filtered Events |
Click to save the log entries in a CSV file in the default download folder of your system. Only the currently visible entries are saved according to the current filter setting. See #Event-Log-Entries for the information stored in the CSV file. |
|
Export System Logs |
Click to save the log entries in a ZIP file containing the individual log files. The #Export-System-Logs-Dialog opens and allows to select the day on which the entries to be saved occurred. The exising entries are saved regardless of the current filter setting. The filename of the log files within the ZIP is the time stamp of the occurrence of the event. |
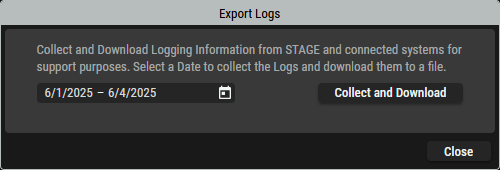
Export System Logs Dialog
The Export Logs dialog can be opened by clicking the Export System Logs button.
|
|
Click to set a date or date range for the log files that are to be downloaded. |
|---|---|
|
Collect and Download |
Click to save the log entries in a ZIP file containing the individual log files for the selected time period. |
|
Close |
Click to exit this dialog. |

Time Range and Custom Date Search Filter
Focus the list of entries for a specific time period.
These options are not available if Auto-Refresh is activated.
|
Select a Time Range |
Select one of the following options from the drop-down list to reduce the display of entries to the corresponding time range:
|
|---|---|
|
Custom Date Search |
Enter the date and time of the period in which the entries are to be displayed. |

Severity, User, Origin Filter, & Trace
Focus the list of entries for Severity, User, Origin, and/or Trace.
|
Severity |
Tick the desired categories that are to be displayed.
|
|---|---|
|
User |
Tick the involved users who triggered the status message. |
|
Origin |
Tick the sources where the condition occurred. |
|
Trace |
Tick to focus on traces. |

Locations Filter
Focus the list of entries for Locations.
|
|
Set a filter to display only content whose search text is found in the name. |
|---|---|
|
Location |
Select one or more locations where the event was triggered. |

Event Log Entries
This section displays the existing entries according to the corresponding filter settings.
|
|
Set a filter to display only content whose search text is found in the name. |
|---|---|
|
Timea |
Shows the time when the event occurred in your local time zone. |
|
Datea |
Shows the date when the event occurred in your local time zone. |
|
System Time |
Shows the UTC date and time when the event occurred. All timestamps for events and logs come from the STAGE cluster and internally time is tracked in UTC as the time-zone reference. |
|
Severity |
Shows a symbol and text to indicate the event’s relative severity.
|
|
Origin |
Shows the event’s source. |
|
User |
Shows the user account that triggered the status message. |
|
Trace |
Shows the result of an event. For example, if a user …
|
|
Description |
Shows the reason for the log entry. |
a. This is the localized time and date converted from UTC using your computer’s or browser’s current time zone setting.
The order and size of the columns can be adjusted by dragging and dropping.
Event Log Severity
The event log has the following severity levels.
|
|
Emergency |
Indicates that the system is unusable. |
|---|---|---|
|
|
Alert |
Indicates that immediate action is necessary to resolve a critical issue. |
|
|
Critical |
Signifies critical conditions in the program that demand intervention to prevent system failure. |
|
Error |
Indicates error conditions that impair some operation but are less severe than critical situations. |
|
|
|
Warning |
Signifies potential issues that may lead to errors or unexpected behavior in the future if not addressed. |
|
|
Notice |
Applies to normal but significant conditions that may require monitoring. |
|
Informational |
Includes messages that provide a record of the normal operation of the system. |
|
|
Debug |
Intended for logging detailed information about the system for debugging purposes. |
|
|
Trace |
More debug information that shows every available log output. |
|
|
Unknown |
Messages that doesn't fit in any other severity level. |