This view allows selecting and managing the various DSP configurations to access their control user interfaces across all running Jobs and accessing audio monitoring and selecting the monitoring source when working with SAME Audio Tools within Jobs.
Starting the Audio Pilot
After opening the Audio Pilot view, the Monitor Selection window is shown.
The left-hand side shows the STAGE location tree to select a Location.
The right-hand side shows a list of all available Audio Monitoring Setups in the selected Location.
Select an Audio Monitoring Setup in the desired Location.
Audio Monitoring Setups are created in the System Commissioning >I/O Management tab.
Failed to load the diagram preview image.
Authentication Required
Page ID: 1645576335
|
Unassigned |
When this option is enabled, Locations without Audio Monitoring Setup are hidden. |
|---|---|
|
Type to Filter |
Set a filter to display only content whose search text is found in the name. |
|
Show unused Audio Monitoring Setups only |
When this option is enabled, currently used audio monitoring configurations are hidden. |
|
|
Shows whether the associated Monitoring Job is currently activated or not. |
|
Name |
Shows the name of the specific Audio Monitoring Setup. |
|
Used by |
Shows the name of the current user, who is using the Audio Monitoring. |
|
|
Opens the selected Audio Monitoring Setup without activating any Monitoring Job. The tools interfaces can be accessed but there is no local monitoring and metering available. |
|
|
By either closing the browser window or clicking the Cancel button, the opening of the Audio Pilot gets aborted and the Home view is shown. |
|
|
Opens the selected Audio Monitoring Setup and starts the audio monitoring. |
Overview
After selecting and activating an audio monitoring configuration, the page with the page/tile configuration that was last used at this audio monitoring location opens.
Failed to load the diagram preview image.
Authentication Required
Page ID: 1645576335

Tiles Page
The Audio Pilot is the engineering user’s central place to access SAME’s audio tools and their monitoring resources (Monitoring- and Listening-Outs).
Just by viewing the tiles the audio can be analyzed and any problems can be directly detected visually. When a tool/process issues an alert, the frame of the corresponding tile turns red until the problem is acknowledged or the alert no longer exists.
Single clicking on a tile opens the respective processing tool’s user interface without audio monitoring it. A tile with an open user interface is indicated by a white border.
Double-clicking on a tile opens the respective processing tool’s user interface and will start audio monitoring it. A tile with enabled audio monitoring is indicated by a blue header and footer.
If the Display Mode is set to “Single”-Browser Window, the tool will open as a non-modal pop-up within the Audio Pilot Main Window.
If the Display Mode is set to “Multiple”-Browser Windows, the tool will always open in a new window, the “Dynamic Tool Control Window”.
Each tile shows the processing type in the header and the name of the job to which it belongs in the footer.
Right-Click Options
Depending on the tile, various options are available.
|
Open UI & Monitor |
Opens the respective processing tool’s user interface and starts the audio monitoring. |
|---|---|
|
Open UI |
Opens the respective processing tool’s user interface. |
|
Monitor |
Starts the respective processing tool’s audio monitoring. |
|
Select Meter |
Selects the corresponding Mixer. |

Monitoring
|
|
Sreen Size: 'Full Screen' enlarges the browser window to the maximum size of the desktop. To exit full screen mode and return to the previous window size, press the ESC key on your keyboard or move the mouse pointer to the top of the screen and click on the Screen Behaviour: When ‘Add Dynamic Screen’ is enabled, clicking on a tile opens the user interface of the corresponding application in a separate browser window, which can be adjusted in size and position and also positioned on a different monitor screen. If not manually closed, the Dynamic Tool Control Window will always stay open and display the user interface of the latest clicked/double-clicked Tile in the Audio Pilot.
|
|---|---|
|
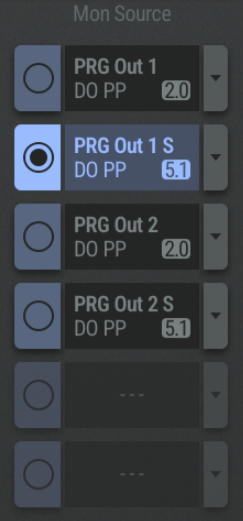
Mon Source
The Selector button has 2 lines for displaying the selected source:
|
|
|
Mon Mode
The Downmix levels are according the ITU-R recommendations.
|
|
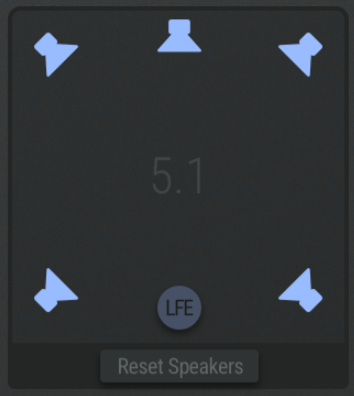
Graphical Speaker Representation
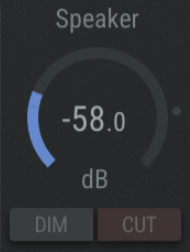
The muting works momentary/latching: A long-press switches back to the previous state on button release and a short press sets the state latching. Reset Speaker
|

|
Main/NF Selection between Main or Near Field Speakers. The selection works momentary/latching: A long-press switches back to the previous speaker on button release and a short press selects the speaker set latching.
|
|
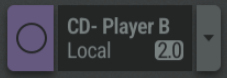
Local Source Pre-Listening
One Local Source can be activated/deactivated and configured using the drop-down on the buttons. |

|
CLR PL
|

|
PL to MON
This does not influence the signal being fed to the Headphones. The Pre-Listen source is always fed to the Headphones. |

|
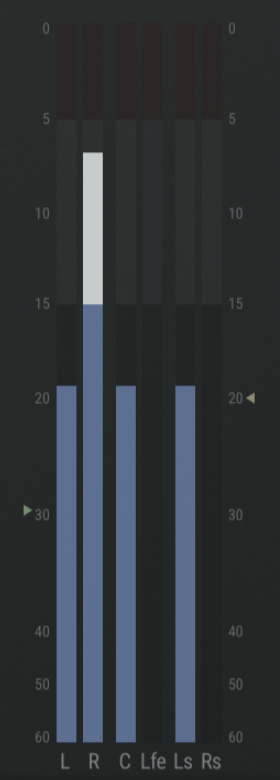
Pre-Listen Peak-Meters
This meter does not show a scale but the actual scale is the same ratio as the Monitoring Main Meter has and the upper scale colours are according the settings for the Monitoring Main Meter. |
|
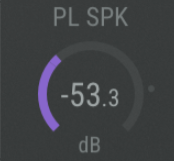
PL SPK / TRIM
|
|
Speaker DIM / CUT
DIM: Dims the currently active speakers.
|
|
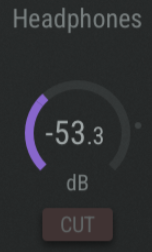
Headphones
|
|
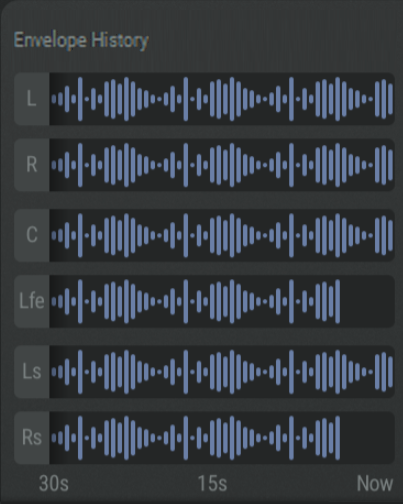
L / R / C / Lfe / Ls / Rs
|
|
Envelope History
|
|
|
Unassigned my Audio Monitoring Setup 1
|
|
|
Time
|

Pages Setup
|
|
Click to edit the currently displayed Tiles Page. See #Edit-Tiles-Page |
|---|---|
|
|
Click to show first/previous page. |
|
|
Click on the desired page button to display it.
|
|
|
Click to add a new page. |
|
|
Click to show next/last page. |
|
|
Click to open a dialog to…
|
Edit Tiles Page
Clicking the ![]()
Job Selection List
In Edit mode, the Job Selection List comes in on the left-hand side:
(The Jobs are created in Jobs > Setup : Applications Tab)
|
Type to Filter |
Filter to display only Subfolders whose search text is found in the name. |
|---|---|
|
Sorting |
Clicking the View Options drop-down button will open a pop-up window to adapt the view. The sorting only affects the Job Level in the Job Selection list. There are options to sort the Job names and Count values in ascending or descending order, as well as options to select Active, Inactive, or All Jobs. |
|
Name |
Shows available Jobs in the system. Expanding a Job will show subfolders for all available processing types assigned to the Job. Subfolders are: Mixers, Network Plugins, Voice Over, Meters & Analyzers, Generatos & Players. Subfolders are only shown if at least on process of this specific type is assigned to the Job, e.g., if there are no mixers assigned to the Job, the Job won’t show the subfolder “Mixers”. Clicking on a Job or Subfolder displays the assigned processes in the center section of the Audio Pilot. |
|
Count |
The Job as well as the Subfolders will show the number of assigned processes of its type in the Job. |
Center section
In Edit mode, the center section gets divided into an upper and a lower section with shrunked tiles.
-
The upper section represents placeholders for 24 tiles on that page.
-
The lower section holds the tiles which can be dragged into the upper section, depending of what is selected in the Job selection list.
-
Tiles can be moved to another placeholder position using drag & drop.
Once you have made all the desired adjustments, click the Edit button again to exit the edit mode.